| Optic
disc imaging forms an essential part of the management of glaucoma suspects
and patients with established glaucomatous visual field loss. The widest
application of optic disc imaging is in glaucoma management and is the
perspective of this review.
 Technological
advances have brought imaging devices into clinical practice, and these
offer considerable advantages over previous methods of recording the appearance
of the optic disc, such as drawings and monoscopic photographs. In this
review, the various forms of imaging are outlined and their clinical application
in diagnosis and management is condiered. Technological
advances have brought imaging devices into clinical practice, and these
offer considerable advantages over previous methods of recording the appearance
of the optic disc, such as drawings and monoscopic photographs. In this
review, the various forms of imaging are outlined and their clinical application
in diagnosis and management is condiered.
The
various forms of imaging permit quantitative measurement of optic disc
and retinal nerve fibre layer (RNFL) structure. There are potential advantage
of quantiative imaging over perimetry, particularly in early disease process
[1].
A number
of different instruments, each making use of different optical principles,
has been introduced over the last 15 years. The technologies are continually
evolving and each is at a different stage of development and clinical evaluation.
Stereoscopic
photography
The
only CE marked, dedicated stereoscopic optic disc camera available in the
UK is the Discam (Marcher Enterprises Ltd). Stereoscopic image pairs are
taken in succession at video frame rates. Newer instruments are full colour
and this is an advantage over all forms of scanning imaging devices (eblow).
The field of view is 12 and pupil dilatation is required for imaging.
The images provide a high magnificaiton, stable picture that can be easier
to evaluate than the image obtained with indirect ophthalmoscopy. New software
enables an observer to make magnification-corrected measurements of optic
disc features. The measurements are, however, subjective, and have greater
between-observer variability than the semi-automated scanning devices.
Scanning
laser tomography
This
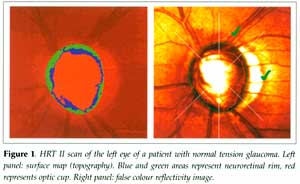
technology, in the form of the Heidelberg retina tomograph (HRT, Heidelberg
Engeineering GmbH), has been available for around 10 years. A compact version
(the HRT II) has been released more recently for clinical use. The field
of view is 15 and imaging can be performed through an undilated pupil.
Images are monochromatic and the confocal optics enable the determination
of a surface height map (topography). The margin of the optic disc is outlined
by an observer and a reference plane is positioned parallel to the surface
and set below the surface [2]. Structures that lie within the disc margin
(contour) and above the reference plane are denoted as neuroretinal rim.
Space below the reference plane is denoted as optic cup (Figure 1).
Scanning
laser polarimetry
This
first prototype of this instrument was developed about 10 years ago, and
was first released commercially as the GDx Nerve fiber analyzer (Laser
Diagnostic Technologies Inc). The second generation product is called the
GDx Access. The field of view is 15 and imaging should be performed through
an undilated pupil. The polarised laser scans the fundus, building a monochromatic
image. The state of polarisation of the light is changed (retardation)
as it passes through birefringent tissue (cornea and RNFL). Corneal birefringence
is eliminated (in part) by a proprietary 'corneal compensator'. The amount
of retardation of light reflected from the fundus is converted to RFNL
thickness. Sub-optimal compensation of corneal birefringence is currently
being addressed by the manufacturer with hardware and software modifications.
Low-coherence
interferometry
The
first commercial application of this technology was released by Humphrey
Instruments (now Zeiss Humphrey Systems) in 1995, as the Optical coherence
tomography scanner. Second and third generations have been produced, giving
faster scanning and greater depth resolution. The principle is analogous
to B scan ultrasonography, using a light source instead of sound. Imaging
is performed through a dilated pupil. The OCT 3 performs a linear scan
on the retina with a near infrared (low coherence) light beam. The depth
resolution is 10 µm. OCT software locates borders (changes in reflectivity)
such as the vitreoretinal interface, the interface between RNFL and inner
retinal layers, and the outer retina/choroid interface.
Laser
optical cross-sectioning
The
commercial instrument utilising this principle is the Retinal thickness
analyzer (RTA, Talia Technology Ltd). The RTA projects a narrow slit of
green laser light at an angle on the retina and acquires an image from
a different angle on a digital camera. An optical cross-section of the
retina is seen, with reflectance peaks that correspond to the RNFL/inner
limiting membrane and the retinal pigment epithelium. The software measures
the distance betweenthe peaks to obtain retinal thickness. The macula,
peripapillary area and optic disc may be scanned. Software to derive an
optic disc topography has also been developed.
The
clinical application of imaging is both for the diagnosis of glaucoma and
the detection of progressive disease. Illustrations will be made with examples
from one of the more mature technologies: HRT. The other instruments may
have a significant clinical role as they are developed further.
Diagnosis
 None
of these instruments, used on its own, is diagnostic. They provide measurement
information that should be integrated with other clinical information,
such as intraocular pressure level and visual field status. None
of these instruments, used on its own, is diagnostic. They provide measurement
information that should be integrated with other clinical information,
such as intraocular pressure level and visual field status.
The
instruments have a database of measurements from normal eyes. The structural
measurements are related to normative data in the same way that visual
field sensitivity is related to normative data in perimetry. Classification
is purely statistical and thresholds for abnormality should be considered
only as levels of probability. Abnormalities other than glaucoma, such
as tilted discs, may cause measurements to fall outside the normal range.
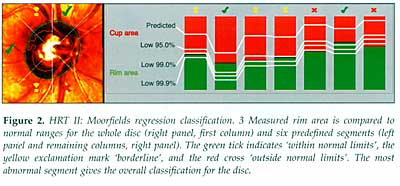
There is an overlap of measurements between normal and glaucomatous eyes,
so that classifications such as 'within normal limits', 'borderline' and
'outside normal limits', as seen in the HRT II (Figure 2) and GDx software,
are appropriate.
With
the Moorfields classification [3], approximately 80% of normal eyes are
identified as 'within normal limits' and 7% as 'outside normal limits'.
Approximately 67% of eyes with early glaucoma are 'outside normal limits'
and a further 20% are 'borderline'. Studies comparing HRT, GDx and OCT
have found that their ability to discriminate between normal and glaucomatous
eyes is generally similar [4, 5]. The GDx performed slightly l ess
well [4]. However, it is anticipated that improved compensation for corneal
birefringence will result in an improved discriminating ability. ess
well [4]. However, it is anticipated that improved compensation for corneal
birefringence will result in an improved discriminating ability.
Progression
The
greatest potential use of imaging instruments is in the detection of glaucomatous
progression. The good reproducibility of measurement data increases the
sensitivity of these instruments to detect progression. Approaches to the
statistical treatment of measurement data include a 'change probability'
analysis for surface height measurements [6], similar to the 'change probability'
in the Statpac software for Humphrey perimetry.
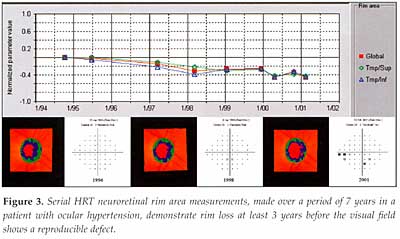
It
is also possible to apply trend analysis to measurements, such as neural
rim area, made at different points in time (Figure 3). The potential advantage
of this form of analysis is that it gives an estimate of the rate of change.
Mr
David Garway-Heath
Consultant
Ophthalmologist, Moorfields Eye Hospital
References
1.
Chauhan BC, McCormick TA, Nicolela MT, LeBlanc RP. Optic disc and visual
field changes in a prospective longitudinal study of patients with claucoma:
comparison of scanning laser tomography with conventional perimetry and
optic disc photography. Arch Ophthalmol. 2001; 119: 1492-1499.
2.
Burk RO, Vihanninjoki K, Bartke T, et al. Development of the standard
reference plane for the Heidelberg retina tomograph. Graefes Arch Clin
Exp Ophthalmol. 2000; 238: 375-384.
3.
Wollstein G, Garway-Heath DF, Hitchings RA. Identification of early glaucoma
cases with the scanning laser ophthalmoscope. Ophthalmology. 1998;
105: 1557-1563.
4.
Zangwill LM, Bowd C, Berry CC, et al. Discriminating between normal
and glaucomatous eyes using the Heidelberg Retina Tomograph, GDx Nerve
Fiber Analyzer, and Optical Coherence Tomograph. Arch Ophthalmol. 2001;
119: 985-993.
5.
Greaney MJ, Hoffman DC, Garway-Heath DF, et al. Comparison of optic
nerve imaging methods to distinguish normal eyes from those with glaucoma.
Invest Ophthalmol Vis Sci. 2002; 43: 140-145.
6.
Chauhan BC, Blanchard JW, Hamilton DC, LeBlanc RP. Technique for detecting
serial topographic changes in the optic disc and peripapillary retina using
scanning laser tomography. Invest Ophthalmol Vis Sci. 2000; 41:
775-782. |